Music Industry Statistics and Trends
The music industry has been slowly migrating over to a growing population of digital sales. Starting in 2011, the revenues began to shift to 50% of sales for the industry being digital and the other 50% based on the physical sale of albums. Digital music sales has hit a retail value of over $3.4 billion and continuing to grow. A look at the different market segments and details of the music industry are listed below.
US Digital Music Sales by Category
The following categories for digital music have seen the below revenue gain in recent times.
1. Digital Tracks – $1.5 billion
2. Digital Albums – $1.1 billion
3. Ringtones – $0.3 billion
4. Subscription – $0.2 billion
5. Digital Performance Royalties – $0.3 billion
US Digital Music Sales Volume
1. Digital Tracks – 1.3 billion units
2. Digital Albums – 105 million units
3. Ringtones – 116 million units
Twitter and the Music Industry
The following video takes a look at Twitter’s connection to the music industry.
Top Countries for Digital Revenue
The following listing of countries are top on the list for seeing the highest percentage of revenue earned from digital sources in the music industry.
1. China – 71%
2. South Korea – 53%
3. USA – 52%
The growth of digital album sales is outlined below.
1. UK – 27%
2. France – 23%
3. United States – 19%
Impact of Piracy
The impact piracy has had on the music industry can seen devastating at times. Here are some statistics of what piracy really costs.
– The US economy loses $12.5 billion in total output annually.
– Piracy has caused a loss of 71,060 jobs.
– US workers lose $2.7 billion annually in earnings.
– Federal, state, and local governments lose $422 million in tax revenues annually.
Volume of Music Not Paid For
Approximately 40% of music is acquired by US consumers by one of the following means without payment.
1. Physical CD’s – 22%
2. Paid Downloads – 15%
3. P2P – 18%
4. Burned from Others – 11%
5. Ripped from Others – 12%
6. Transferred from External Hard Drive – 18%
7. Downloaded from Digital Storage Locker – 3%
Music Consumption Facts
A collection of interesting facts about music consumption and behaviors.
– 8 million different songs were downloaded in 2011.
– The top 200 downloaded songs account for 20% of digital song sales.
– The top 3,300 downloaded songs account for half of digital song sales.
– The top 10,000 downloaded songs account for 65% of digital song sales.
– Less than 1% of all new album releases account for 70% of all new album release sales.
– 94% of all new released in 2011 sold less than 1,000 units each. 80% sold less than 100 units.
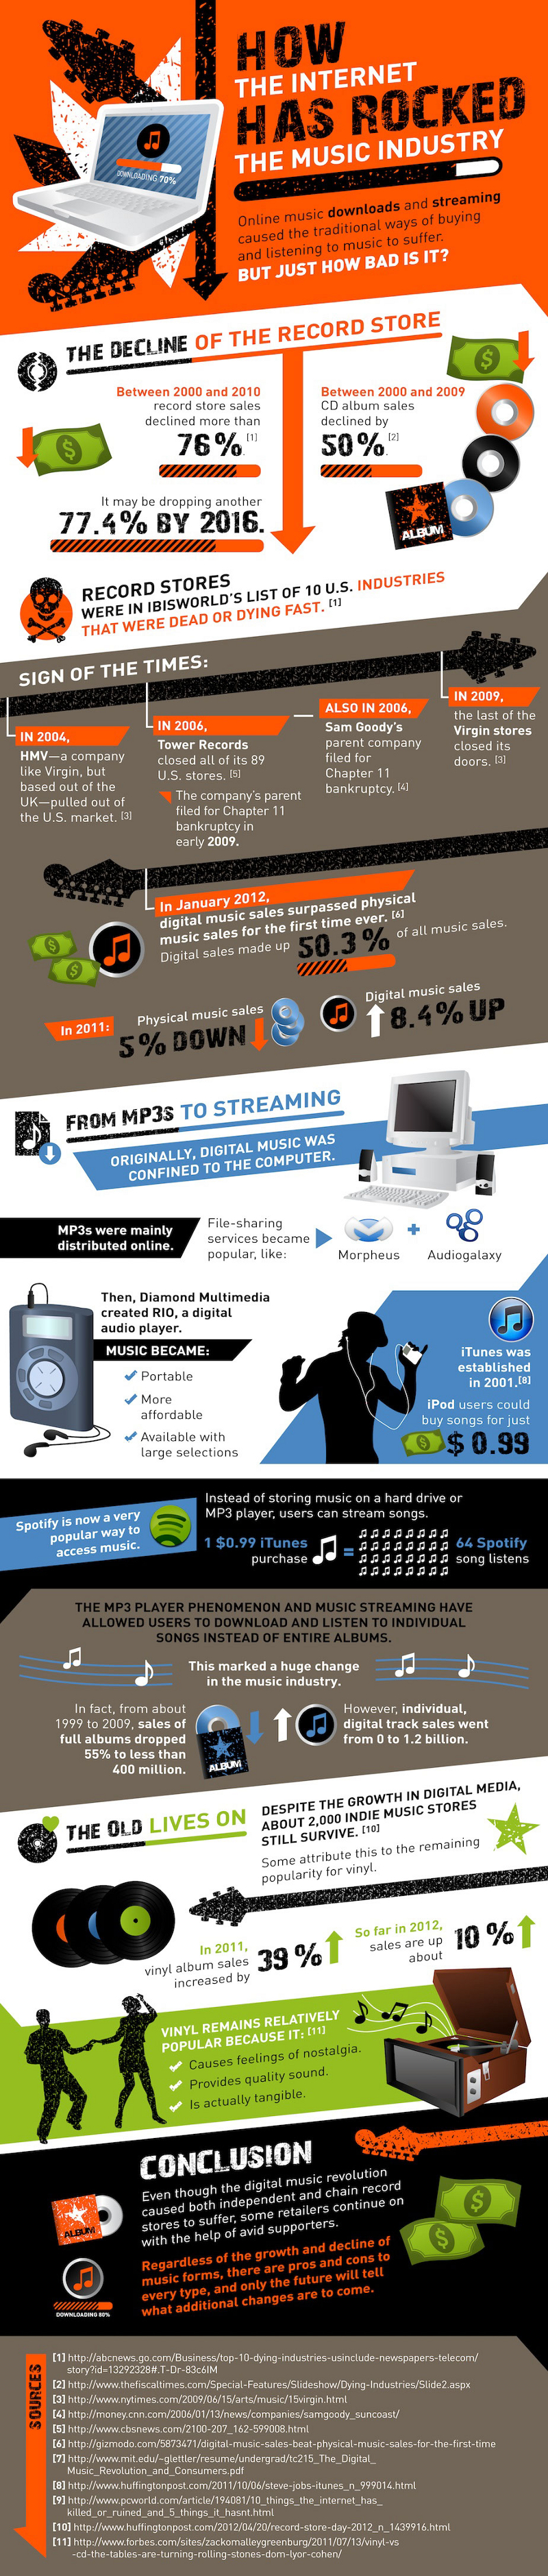
Impact of Internet on Music
Records store have been considered one of the top 10 dying industry due to the growth of the internet and digital music. Approximately 2,000 indie style music stores are still managing to stay alive due to almost a 40% growth in vinyl sales.
Although millions of people visit Brandon's blog each month, his path to success was not easy. Go here to read his incredible story, "From Disabled and $500k in Debt to a Pro Blogger with 5 Million Monthly Visitors." If you want to send Brandon a quick message, then visit his contact page here.
Comments are closed.