Soda is one of the biggest contributors of empty calories to a person’s diet today. Just one 12 ounce can of soda can contribute over 150 calories to a person’s diet. When a 20 ounce bottle or greater is introduced, then the calorie counts can easily exceed 250. What’s worse is the fact that the majority of these calories are based on sugar.
63% of Americans say that they are actively avoiding the consumption of soda on a regular basis.
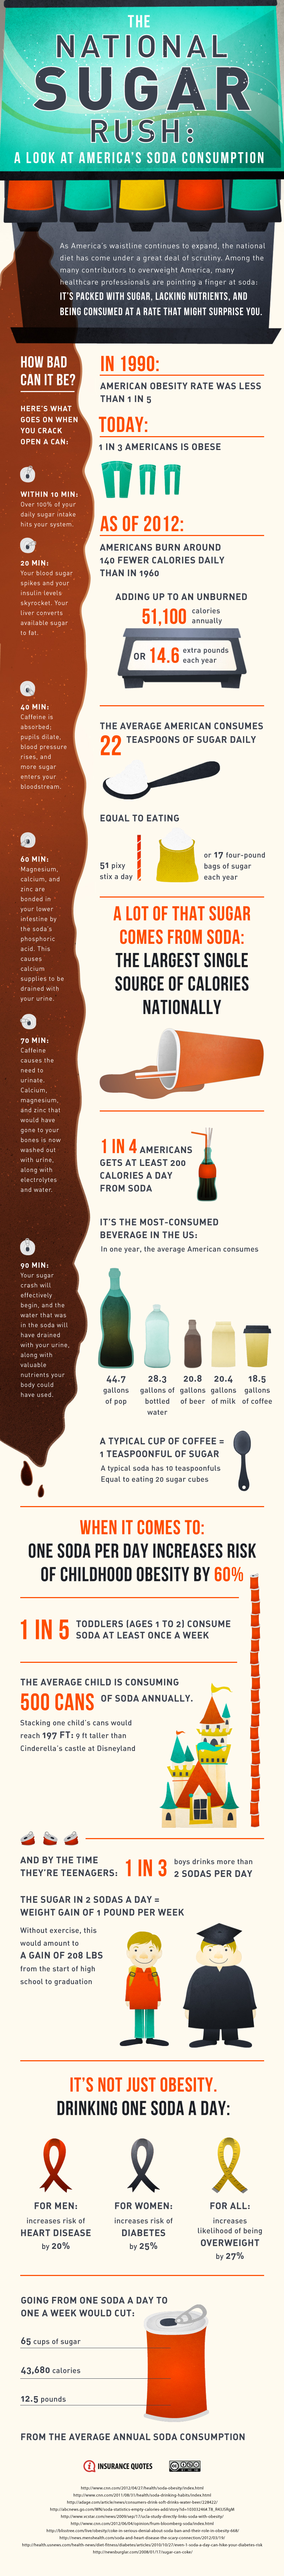
Soda Consumption
This is a major increase since 2002. In that year, just 41% of Americans stated that they were actively trying to avoid soda. There is no breakdown on whether or not people consider an energy drink as being a soda or being a separate beverage, however, so the statistics on soda consumption may have a certain bias to them.
- The average American consumes 44 gallons of soda every year, a 20% overall decline from peak rates in the 1990s.
- Sales of sparkling water jumped 8.6% between 2009 and 2011 while soda sales slumped.
- 33 states. That’s the number of locations where a specific tax on soda products has been introduced.
- Men typically drink more soda than women.
- People from the African-American ethnic demographic drink more sodas than any of their counterparts.
- When household incomes rise, the amount of soda that is consumed actually decreases.
- Children between the age of 12-19 [70% of all kids] drink the most soda when compared to all age groups. Adults in the 20-39 age demographic come in second place.
- 1.4%. That’s the percentage of soda beverages that are purchased at a school or daycare setting.
- 92% of the soda that is consumed at home is purchased from a local store.
- In 2015, some 40.7 gallons of soft drinks were consumed per capita, down from 45.5 gallons per capita in 2010.
- In 2016, energy drinks accounted for a market share of about 10.2 percent of the U.S. soft drink segment.
Soda consumption happens because it is a cheap drink that isn’t water. Although tap water is basically free and unlimited as a resource, it isn’t utilized because it isn’t sugary. The human brain reacts to sugar as it does when it receives other rewards-based substances. It feels good to eat sugar, so the body craves more of it. The body needs water, but because there isn’t the psychological reward in consuming it, people are often going to choose the sugary drink over the healthy drink because it makes them feel better. The only problem is that the short-term rewards could be leading to some severe long-term consequences.
How Big Is The Soda Industry?
- More than $75 billion of soda is purchased every year. Although the industry has seen overall unit decreases in sales, price increases have made up the difference to create relatively stable sales numbers.
- The peak of soda consumption came in the 1980s and 1990s when fountain drink sizes grew by 50% and the 20 ounce plastic bottle was brought to the US market.
- Americans are drinking the equivalent of 450 cans of soda per year, which matches the numbers that were seen in 1986.
- To recover sales, soda manufacturers have reduced the sizing of their containers to 7.5-8 ounces instead of 12-20 ounces. Adding in personalized marketing to these changes saw sales increase by 1%.
- In 2013, Diet Coke sales dropped by 7%. Carbonated soda sales dropped by 2% overall as an industry.
- A 20 oz bottle of cola contains the equivalent of 16 teaspoons of sugar in the form of high fructose corn syrup.
The health risks of consuming soda are well known. Not only does it contribute to higher risks for diabetes development, but it can also contribute to excessive weight gain. More than two-thirds are listed as being overweight because of their BMI. For a long time, the alternative of diet sodas was thought to be healthier. Marketing as a zero calorie option, research has shown that diet soda drinkers have the same health issues as regular soda drinkers. This is why more people than ever before are avoiding soda whenever possible.
What Are The Costs of Soda Consumption?
- The United States spends an estimated $190 billion a year treating obesity-related health conditions.
- A 64-ounce fountain cola drink could have up to 700 calories.
- Beverage companies in the US spend roughly $3.2 billion annually to market carbonated beverages.
- Preschoolers view an average of 213 ads for sugary drinks and energy drinks every year. This figure doubles once children reach their teen years.
- In the 1970s, sugary drinks made up about 4% of US daily calorie intake; by 2001, that had risen to about 9%.
- Children and youth in the US averaged 224 calories per day from sugary beverages in 1999 to 2004.
All it takes is one soda per day to set the conditions for a person to begin gaining weight over time. Although the increase averages 1 pound over the course of 4 years, that’s a lot of extra weight when soda consumption starts in the childhood years. By the time someone reaches the age of 40, they have gained 10 extra pounds due to soda consumption alone. Add in other unhealthy habits like excessive red meat consumption or a lack of exercise and it is easy to see why there are so many health risks associated with soda consumption.
How Many Kids Are Consuming Soda?
- Calories from sugary beverages have increased by 60% in children ages 6 to 11 in the last 10 years.
- 9 out of 10 children in the United States regularly consume at least one soda per day.
- On any given day, half of all Americans are going to consume at least 1 soda. 5% of them will consume over 550 calories because of their soda consumption.
- Averaging just one can of a sugary beverage per day had a 20% higher risk of having a heart attack.
- 75%. That’s the increased risk of gout in women that comes from regularly consuming at least one can of soda.
- Children who are classified as being overweight are able to reduce or manage their weight more effectively be eliminating soda.
- Children in the 2-5 age demographic consume the same levels of soda has people in the 60 and older senior demographic.
Kids love to have a soda because it tastes so sweet. They also don’t have the control to limit themselves to low levels of soda consumption, especially at a young age. That means parents need to know soda consumption statistics like these to make sure healthy choices are emphasized in households around the world. All it takes is one soda every day, on average, to permanently change a person’s life. Actively avoiding soda consumption makes it possible to achieve health goals more effectively so that weight levels can be better controlled.
Although millions of people visit Brandon's blog each month, his path to success was not easy. Go here to read his incredible story, "From Disabled and $500k in Debt to a Pro Blogger with 5 Million Monthly Visitors." If you want to send Brandon a quick message, then visit his contact page here.