Four Trends In European Digital Consumption
A listing of trends that are common among European shoppers to increase their overall market and grow brands.
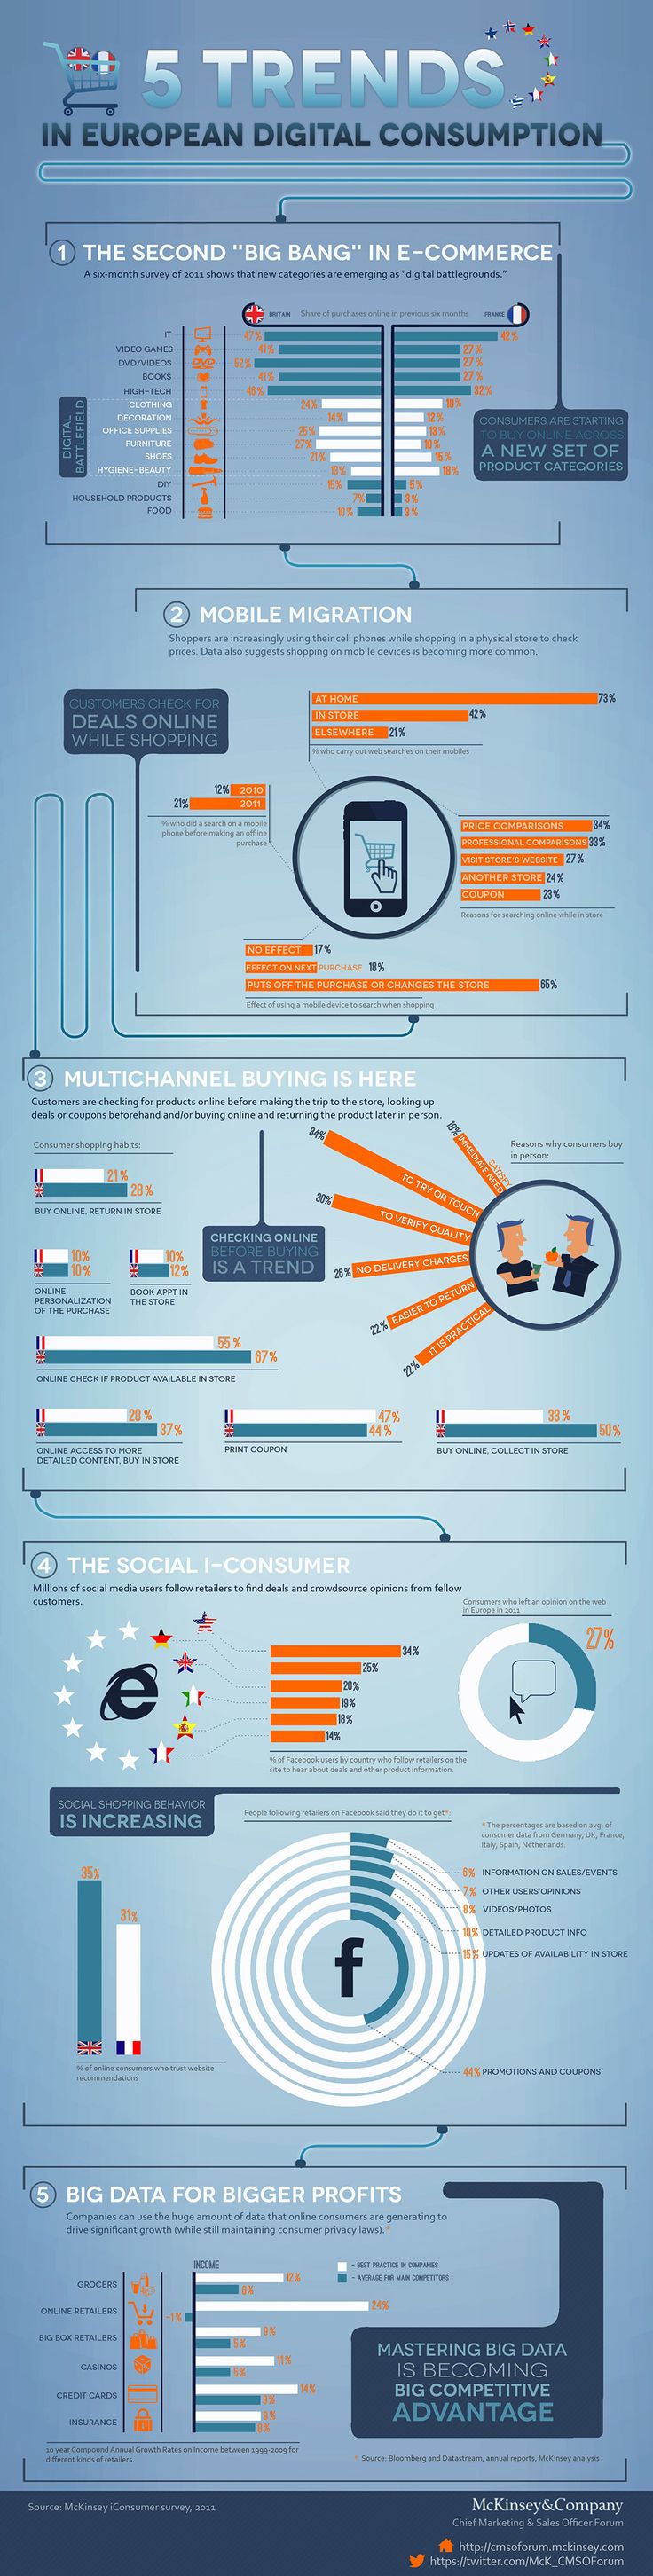
The Second “Big Bang” in E-Commerce
A six month survey in 2011, shows the following new categories as coming out as “digital battlegrounds.”
1. IT
Britain: 47 percent.
France: 42 percent.
2. Video Games
Britain: 41 percent.
France: 27 percent.
3. DVD/Videos
Britain: 52 percent.
France: 27 percent.
4. Books
Britain: 41 percent.
France: 27 percent.
5. High Tech
Britain: 48 percent.
France: 32 percent.
6. Clothing
Britain: 24 percent.
France: 19 percent.
7. Decoration
Britain: 14 percent.
France: 12 percent.
8. Office Supplies
Britain: 25 percent.
France: 13 percent.
9. Furniture
Britain: 27 percent.
France: 10 percent.
10 Shoes
Britain: 21 percent.
France: 15 percent.
11. Hygiene Beauty
Britain: 13 percent.
France: 18 percent.
12. DIY
Britain: 15 percent.
France: 5 percent.
13. Household Products
Britain: 7 percent.
France: 3 percent.
14. Food
Britain: 10 percent.
France: 3 percent.
Mobile Migration
Shoppers are using their cell phones while shopping in a physical store to check prices more and more. Data also suggests that shopping on mobile devices is now more common.
People use their mobile device the most:
• At home: 73 percent.
• In store: 42 percent.
• Elsewhere: 21 percent.
• In 2010: 12 percent.
• In 2011: 21 percent.
Reasons for searching online while in a store:
• Price comparisons: 34 percent.
• Professional comparisons: 33 percent.
• Visit store’s website: 27 percent.
• Another store: 24 percent.
• Coupon: 23 percent.
Effects of using a mobile device to search when shopping.
• No effect: 17 percent.
• Effects on next purchase: 18 percent.
• Puts off the purchase or changes the store: 65 percent.
Multi-channel Buying is Here
Customers are checking for products online before making the trip to the store, looking up deals or coupons beforehand and/or buying online and returning the product later in person.
Customers Shopping Habits
In France, 21 percent of people buy their products online and return them in the store. In Britain the percentage is 28 percent.
1. Online personalization of the purchase:
France: 10 percent.
Britain: 10 percent.
2. Book appt in the store:
France: 10 percent.
Britain: 12 percent.
3. Online check if product is available in the store:
France: 55 percent.
Britain: 67 percent.
4. Online access to more detailed content, buy in store:
Britain: 37 percent.
France: 28 percent.
5. Print coupon:
Britain: 44 percent.
France: 47 percent.
Buy online, collect in store:
France: 33 percent.
Britain: 50 percent.
Reasons why consumers buy in person:
• Immediate need: 18 percent.
• To try or touch: 34 percent.
• To verify quality: 30 percent.
• No delivery charges: 26 percent.
• Easier to return: 22 percent.
• It is practical: 22 percent.
Big Data For Bigger Profits
Companies can use the huge amount of data that online consumers are generating to drive significant growth (while still keeping consumer privacy laws). Mastering Big Data is becoming big competitive advantage.
Although millions of people visit Brandon's blog each month, his path to success was not easy. Go here to read his incredible story, "From Disabled and $500k in Debt to a Pro Blogger with 5 Million Monthly Visitors." If you want to send Brandon a quick message, then visit his contact page here.