Bakery Industry Statistics
The bakery industry is made up of almost 3,000 independent bakeries that see an annual revenue of $30 million along with 6,000 retail bakeries that bring an additional $3 billion. The commercial side of the bakery industry is highly concentrated with 50 of the largest companies generating 75% of revenue. On the retail side, a highly fragmented industry generates only 15% of the revenue with the top 50 companies. A breakdown of this industry is listed below.
Bakeries Share of Total Revenue
Commercial – 91%
Retail – 9%
Bakeries Share of Total Locations
Commercial – 32%
Retail – 68%
Bakery Industry Product Segments
A breakdown of the product segments within this industry are listed below.
– Bread: 32%
– Rolls: 19%
– Frozen Cakes: 15%
– Retail Bakery Products: 10%
– Soft Cakes: 8%
– Pies: 2%
Restaurant Nightmare
A look at the story of one valley restaurant owner that was hacked and suffered their own nightmare after an aired segment on Kitchen Nightmares.
Bakery Industry Opportunities
A growing demand in the bakery industry has seen new opportunities with growth in the following product segments.
– Artisan Breads
– Par Baking
– Organic Goods
6 Tips of Bakery Success
The following tips have been identified by IBISWorld as contributing to a bakeries independent success.
1. Ability to pass cost increases to the customer.
2. Secure supply contracts for key ingredients.
3. Close proximity to key markets.
4. Efficient work practices.
5. Product differentiation.
6. Ability to adapt and change.
Industry Risks
The following risks are associated with the bakery industry.
1. Volatility of raw materials and energy costs based on prices of wheat and vegetable oil that can vary as much as 40% in a single year.
2. Competition from customers within a consolidating supermarket industry.
3. Low demand growth tied to the growth of the US population which is only 1% each year.
4. Contamination with allergens from food equipment that is not cleaned properly.
5. Appealing to consumer tastes and dietary trends such as low carb and gluten free options.
6. People aged 65 years or older spend 12 to 17 percent more than the average household on prepared desserts.
7. Consumers are expected to continue to trend toward health eating and increase demand for items like fortified breads, gluten-free loaves and sprouted and organic sweets.
Top Importing Countries of US Baked Goods
The US Bread Production Industry has seen exports rise to over $1 billion dollars with a growth of 7.2%. This market is broken down into the following largest importing countries of US baked goods.
1. Canada – 80%
2. Mexico – 10%
3. Japan – 6%
4. Korea – 2%
5. United Kingdom – 2%
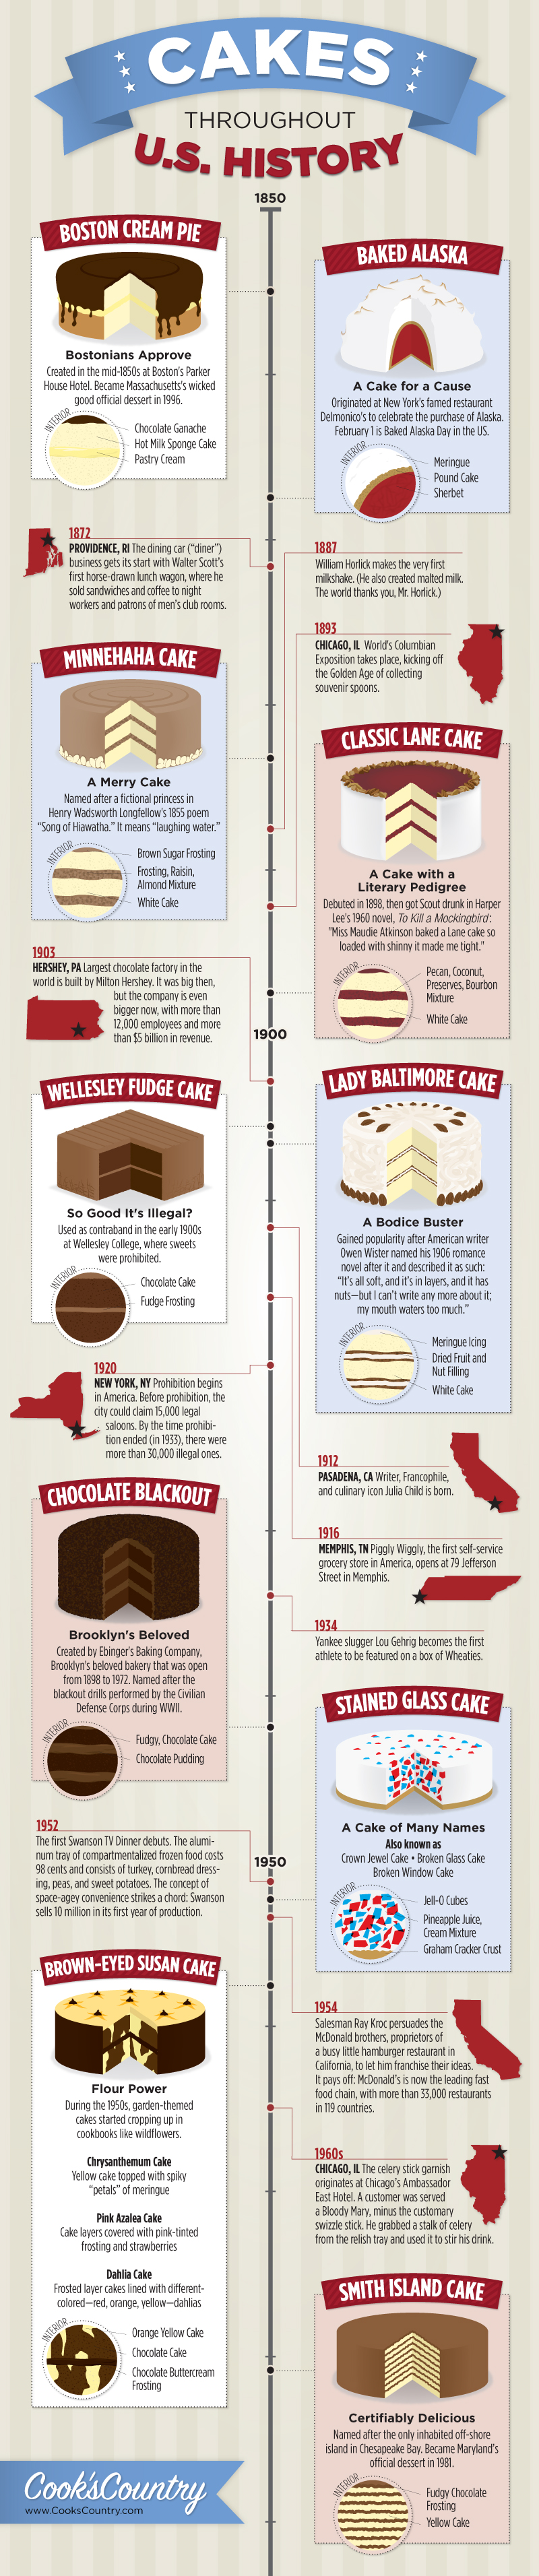
History of Cakes
Trends in cakes began in the mid 19th century when the Bostonians approved the Boston Cream Pie. Made with Chocolate Ganache and a hot milk sponge cake with pastry cream, the era of cakes began. The following infographic highlights some of the biggest trends seen in cake baking.
Although millions of people visit Brandon's blog each month, his path to success was not easy. Go here to read his incredible story, "From Disabled and $500k in Debt to a Pro Blogger with 5 Million Monthly Visitors." If you want to send Brandon a quick message, then visit his contact page here.