Automobile Industry Statistics
The automobile industry has been seeing a surge ahead of growth since the economic recession slowed the market down. Asia is considered to be the biggest right now followed by North America for car and light truck sales. The growth of SUV’s have been strong in Europe while Korea firms such as Kia and Hyundai are taking on aggressive marketing tactics against large automobiles to complete more globally.
There is an estimated 1 billion cars and lightweight trucks on the road as of 2013. This number is expected to increase by 40 million each year. Technological changes and more fuel efficiency in vehicles are setting the trends for future designs. The following automobile industry statistics make up the overall industry’s wealth and future growth.
Market Share
• General Motors – 19.4%
• Ford – 16.5%
• Toyota – 12.6%
• Chrysler – 10.5%
• Honda – 9.7%
Top Global Auto Manufacturers
Based on the total global units sold, the following auto manufacturers topped the chart in 2012.
1. General Motors – 9.49 million unit sales.
2. Volkswagen – 9.34 million unit sales.
3. Toyota – 8.87 million unit sales.
4. Hyundai/Kia – 7.10 million unit sales.
5. Ford – 5.67 million unit sales.
6. Nissan – 4.91 million unit sales.
7. Honda – 4.01 million unit sales.
8. Fiat/Chrysler – 4.29 million unit sales.
The Business of US Auto Industry
The following video performs and analysis to the current United States auto industry and present growth trends.
Top 10 Vehicles
Based on the year to date sales for 2013, the following vehicles have been seen at the top of list for making the most revenue. Their current unit sale total is outlined below.
1. Ford F Series Pick Up – 623,309 units
2. Chevy Silverado – 403,435 units
3. Toyota Camry – 348,134 units
4. Honda Accord – 307,241
5. Dodge Ram Pick Up – 292,633
6. Honda Civic – 280,889
7. Nissan Altima – 271,303
8. Toyota Corolla – 257,184
9. Honda CR-V – 251,636
10. Ford Escape – 250,543
Car Colors Based on Gender
Studies have shown that each male and females each prefer some car colors more than others. A breakdown of these preferences and percentage of change are listed below.
Men
Red: +12.3%
Orange: +11.8%
Black: +9.6%
Women
Silver: +9.2%
Brown: +9.1%
Gold: +7.3%
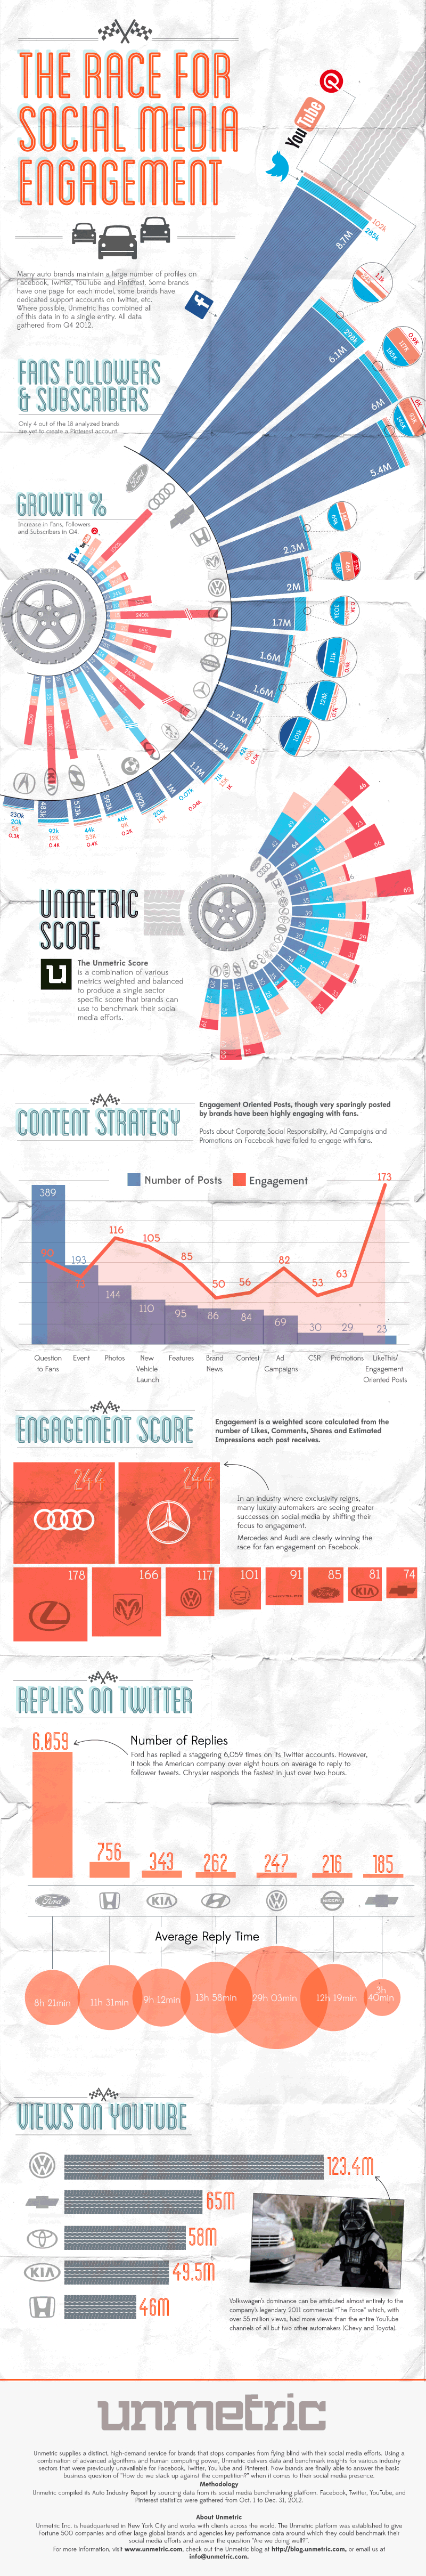
Social Media of the Auto Industry
The following infographic outlines some of the biggest automobile brands and names in the industry and their statistics for social media engagement. Based on how much they interact with their consumers, the following of these brand pages can see horrendous growth opportunity.
Although millions of people visit Brandon's blog each month, his path to success was not easy. Go here to read his incredible story, "From Disabled and $500k in Debt to a Pro Blogger with 5 Million Monthly Visitors." If you want to send Brandon a quick message, then visit his contact page here.