Disturbing Identity Theft Statistics
Approximately 15 million people in the United States fall victim to identify theft with financial losses totaling upwards of $50 billion. An estimated 100 million have their personal information compromised placing them at risk through government and corporate databases that are lost or stolen. This makes identify theft the most frequent and costly crime in the United States.
How Identify Theft is Defined
Identify theft is defined as one of the following incidents.
1. Unauthorized use or attempted use of existing credit cards.
2. Unauthorized or attempted use of checking accounts.
3. Misuse of personal information to obtain new accounts or loans.
Common Forms of Identify Theft
the following forms have been the result of identity theft occurring.
1. Government documents/benefits fraud – 46%
2. Credit card fraud – 13%
3. Phone/Utilities fraud – 10%
4. Bank fraud – 6%
5. Employment related fraud – 5%
6. Loan fraud – 2%
CNN Reports on Identity Theft Statistics
The following video is from CNN Live news reporting on recent cases of identity theft and the statistics of these cases occurring.
Child Identify Theft and Fraud Statistics
1. Social security numbers are the most commonly used in targeting children.
2. 56% of individuals have reported theft or misuse of a child’s social security number.
3. 1 in 40 respondents had a child that fell victim with a national average of 2.5%.
4. 27% of individuals know the individual responsible for the crime.
5. The risk of child identity fraud increases in lower income families average 50% of households having income under $35,000.
6. It can take an average of 334 days to detect identity theft and fraud committed towards a child with 17% being victimized for a year or longer.
Top 5 State with Highest Rate of Identity Theft
The following rates show the states with the highest risk of identity theft per every 100,000 residents.
1. Arizona – 149
2. California – 139.1
3. Florida – 133.3
4. Texas – 130.3
5. Nevada – 126
Top 5 States with Lowest Rate of Identity Theft
The following rates show the states with the lowest risk of identity theft per every 100,000 residents.
1. South Dakota – 33.8
2. North Dakota – 35.7
3. Iowa – 44.9
4. Montana – 46.5
5. Wyoming – 46.9
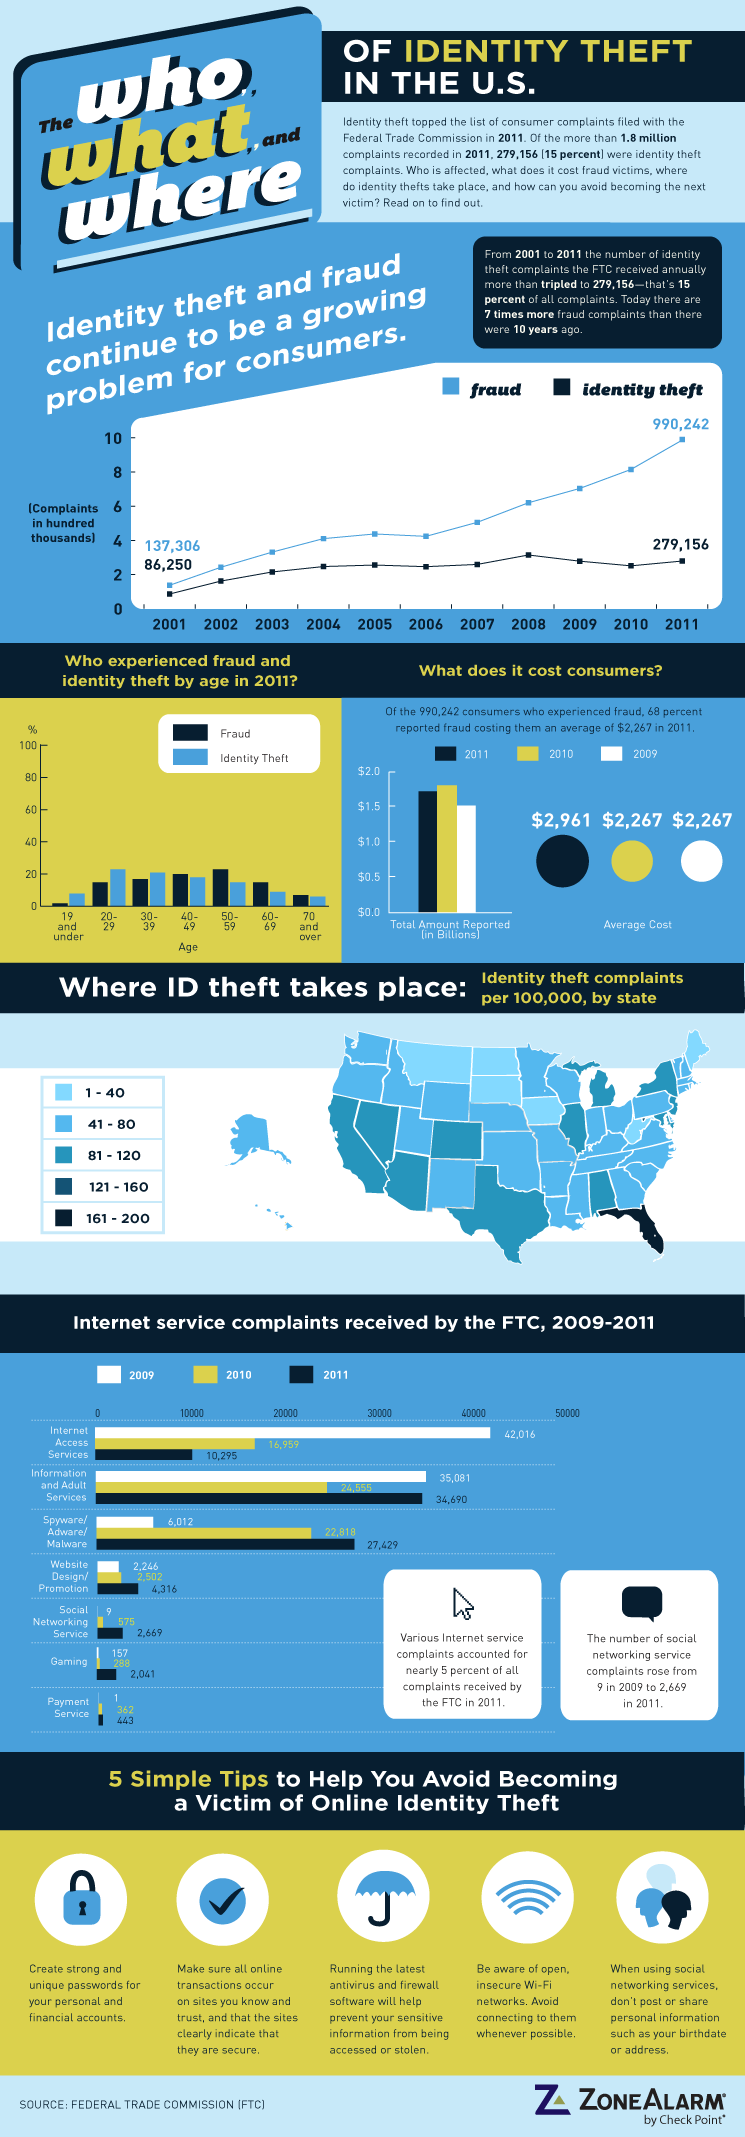
US Statistics of Identity Theft and Fraud
The following infographic outlines the statistics regarding fraud as a result of identity theft and the most prominent places it occurs at.
Although millions of people visit Brandon's blog each month, his path to success was not easy. Go here to read his incredible story, "From Disabled and $500k in Debt to a Pro Blogger with 5 Million Monthly Visitors." If you want to send Brandon a quick message, then visit his contact page here.