Real Estate Industry Statistics
The real estate industry consists of over 9 million jobs. The construction industry includes an additional 1.6 million self employed builders and 6.7 million wage and salary positions for employment. The growth of the real estate industry will have a demand for 1.1 million more special trade contractors. According to the Real Estate Roundtable, the following statistics capture the current real estate market.
Real Estate Market
There are approximately 200 publicly traded real estate investment trusts in the United States today. The total equity market capitalization is $312 billion with tens of thousands of individual investors owning shares.
Real Estate Market Outlook
According to Real Estate Business Intelligence, as of September 2013, the current real estate market outlook is based on the following figures.
1. Total Sold Dollar Volume: $3.392 Trillion
2. Closed Sales: 9,365 Homes
3. Median Sold Price: $295,000
4. Average Sold Price: $362,278
5. Average Days on Market: 60 Days
6. Average Sold to Original List Ratio: 95.88%
Future Trends of Real Estate Industry
The following video captures the futures trends and outlook of the real estate industry. The strategies discussed will help you gear future marketing efforts towards the right path.
Commercial Real Estate
The overall commercial real estate industry is worth $5 trillion. This is broken down into the following sectors.
1. Commercial Office Space: 4 billion square feet.
2. Industry Property: 13 billion square feet.
3. Shopping Center Space: 9.5 billion square feet.
4. Hotel Rooms: 4.4 million square feet.
5. Rental Apartment Space: 33 million square feet.
Foreclosure Rates for the United States
According to RealtyTrac, the current overall foreclosure rate in the nation is one home per every 998 homes. The following list is of the highest 5 states foreclosure rates in the United States.
1. New Jersey: 1 in every 656
2. Maryland: 1 in every 566
3. Illinois: 1 in every 528
4. Florida: 1 in every 406
5. Nevada: 1 in every 249
US Foreclosure Status Distribution
The following percentages represent the current distribution of foreclosures based on the active number of homes. These rates are compared to last years.
Pre-Foreclosures
Distribution of Current Foreclosures: 30.9%
Last Month Comparison: 4.5%+
Prior Year Comparison: -27.9%
Auction
Distribution of Current Foreclosures: 39.9%
Last Month Comparison: 3.7%+
Prior Year Comparison: -25.9%
Bank Owned
Distribution of Current Foreclosures: 29.2%
Last Month Comparison: -2.4%
Prior Year Comparison: -28.4%
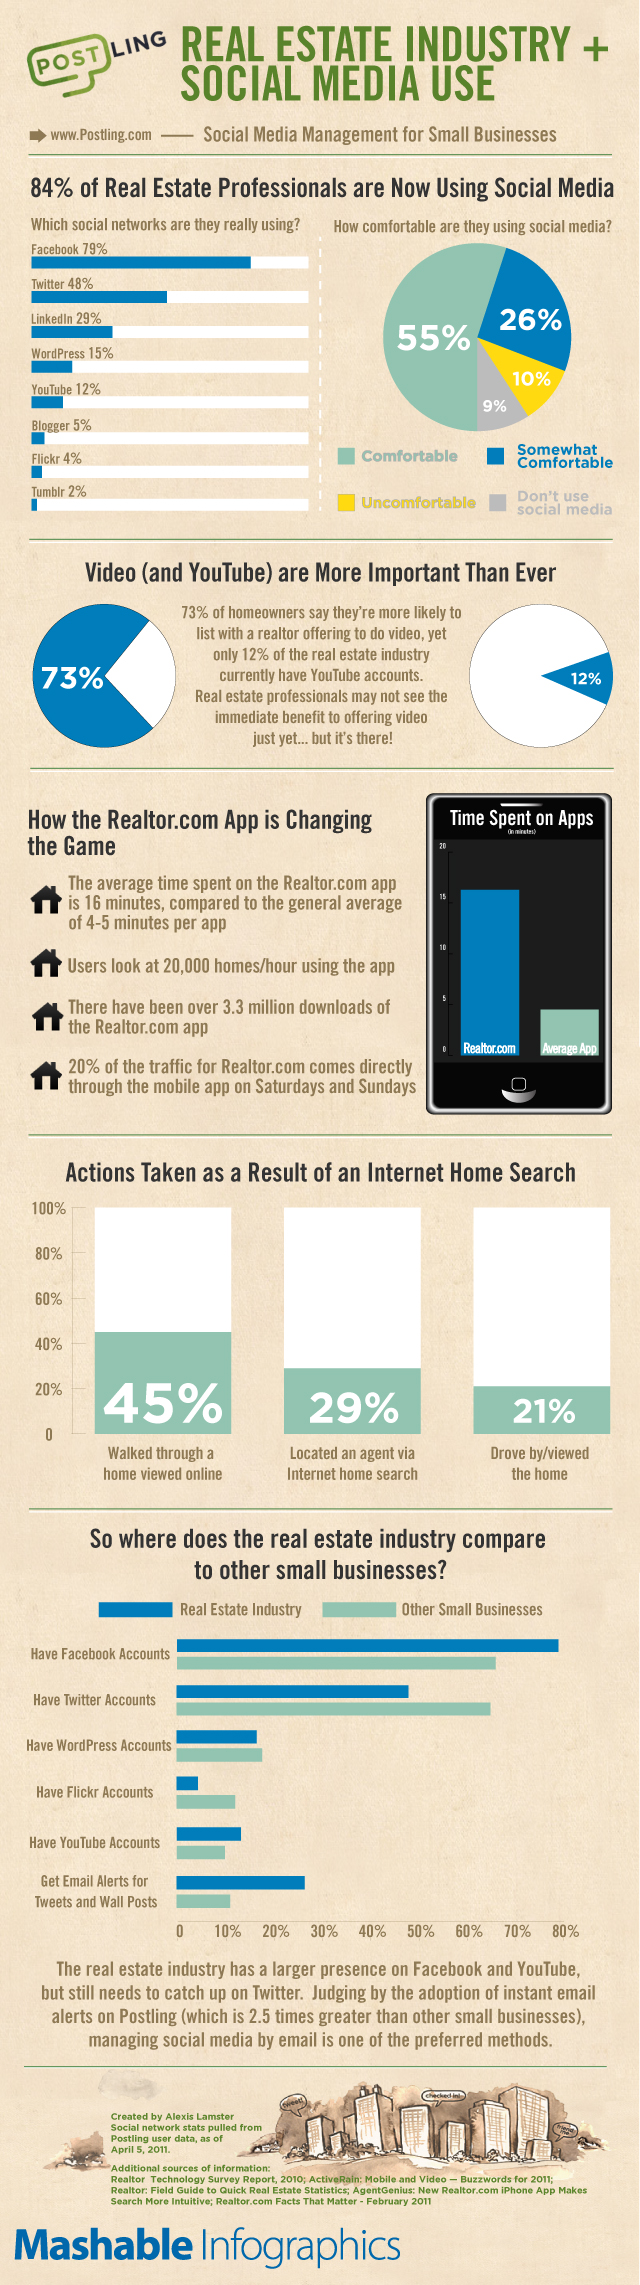
Real Estate Industry Marketing on Social Media
Statistics on how viewers interact with social media and the real estate industry. From realty apps to YouTube videos, present day technologies allow you to engage potential clients and increase leads from simple internet marketing techniques.
Although millions of people visit Brandon's blog each month, his path to success was not easy. Go here to read his incredible story, "From Disabled and $500k in Debt to a Pro Blogger with 5 Million Monthly Visitors." If you want to send Brandon a quick message, then visit his contact page here.