Bottle Water Industry Statistics
According to the Bottled Water Associated, in 2012 the overall consumption of bottled water increased 6.2% with sales up 6.7%. Current consumption growth is the strongest and highest it has been in the past five years. In 2015, the total volume of bottled water consumed in the United States was 11.7 billion gallons. The following statistics provide a snapshot of the bottle water industry.
Market Consumption Statistics
1. Total bottle water consumption: 9.67 billion gallons.
2. Per capita consumption: 5.3%
3. Average consumer consumption: 30.8 gallons of water a year.
4. Bottle water sales: 6.7% increase totaling $11.8 billion.
5. Average plastic bottle per person: 167 annually.
The bottle water industry increased in absolute volume more than any other beverage category in the United States.
Bottle Water Industry Corruption
A look at the big business side of the bottle water industry and its impact on consumer health, climate change, pollution, and reliance on oil. An snapshot of this unregulated industry that privatizes a based commodity to the world.
Bottle Industry Market Share
6. Total spent annually on bottle water: $15 billion.
7. Amount of bottle water sold by Pepsi and Coke annually: 24%
8. Percentage of bottle water market owned by Coke and Pepsi: 50%
9. Amount of bottle water sold annually by Coke and Pepsi: 3.36 bilion.
10. Profit generated by Coke and Pepsi: $336 million annually.
11. Total amount of cases sold in the United States: 2.6 billion.
12. Total global water bottle annual sales: $50 billion.
13. Total cost of monthly water bills if tap cost the same as cheapest bottle: 9,000.
Distribution Cost Breakdown
Of the average estimated cost of $1.29 per water bottle, here is the breakdown of where the money goes.
Retailer: $0.63
Transportation: $0.43
Water Bottle Production: $0.12
Profit: $0.10
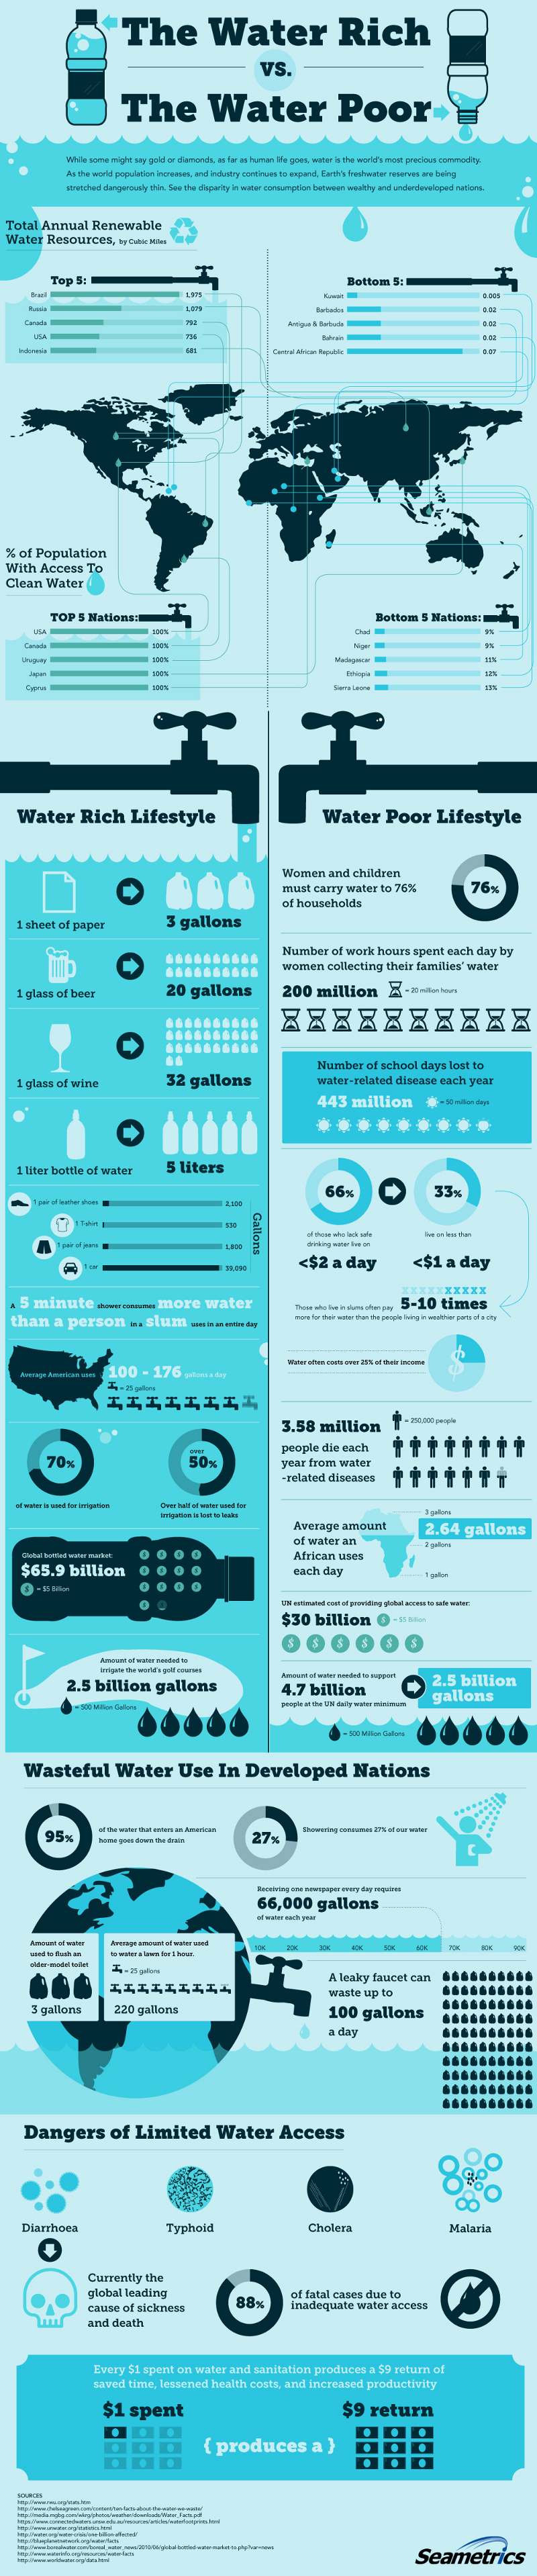
Global Water Resources
The world’s top renewable water resource is known as Brazil. However, the USA is the one national with the highest population access to clean water. The below infographic outlines the consumption rates and statistics of our most precious resource.
Although millions of people visit Brandon's blog each month, his path to success was not easy. Go here to read his incredible story, "From Disabled and $500k in Debt to a Pro Blogger with 5 Million Monthly Visitors." If you want to send Brandon a quick message, then visit his contact page here.