Event Planning Industry Statistics
According to Inside Business, the event planning industry is expected to grow 20% with the median income of an event planning being $42,180 a year. By 2016, this industry is expected to grow to over 60,000 jobs. 50% of event revenue comes from registration, while food and beverage eats up 33% of expenses.
Top 4 Industries for Event Planning
The following list of industries is considered the top four that employ event planners.
1. Business, Labor, and Political Organization
2. Hotels and Motels
3. College Universities and Professional Schools
4. Grand Making and Giving Services
Top 5 States for Event Planners
The current list of states is considered the top places for event planning employment. The following statistics are of the current number of positions held in the industry.
1. California – 7,730
2. New York – 7, 250
3. Texas – 6,320
4. Florida – 3,560
5. Virginia – 3,500
Day in the Life of an Event Planner
A video capturing a day in the life of an event planner.
Top 5 Paying States
The highest paying event planning locations and average yearly earnings.
1. Virginia – $54,770
2. New York – $57,300
3. New Jersey – $57,730
4. Massachusetts – $58,860
5. Washington DC – $67,120
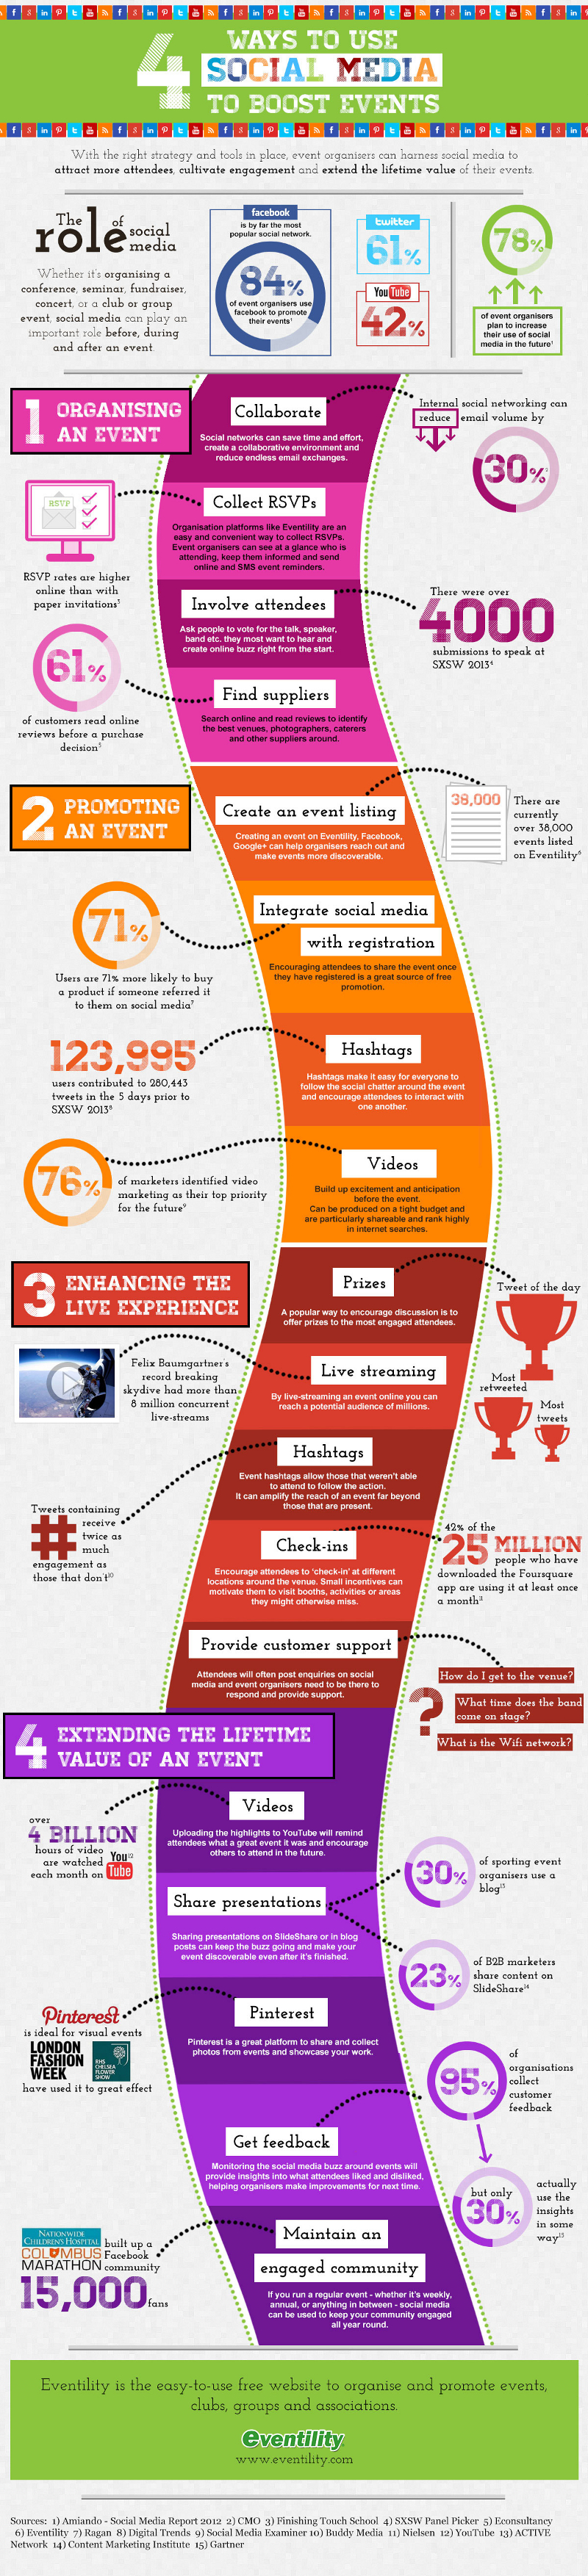
Event Planning and Social Media
Social media has offered new trends with event planning when it comes to organizing a conference, seminar, fundraiser, or event. The below infographic provides a guide to the four main components for integrating social media with your event.
Although millions of people visit Brandon's blog each month, his path to success was not easy. Go here to read his incredible story, "From Disabled and $500k in Debt to a Pro Blogger with 5 Million Monthly Visitors." If you want to send Brandon a quick message, then visit his contact page here.