Infographics Are The Preferred Way To Share and Receive Information
It is no surprise to learn that most individuals prefer visual information over written word. However, the popularity of infographics clearly shows that the brain is always looking for visual information, because this type of information is easier to process. Communication with the use of pictures, charts and graphs has been around for centuries, but infographics innovations allows information to be shared in new ways.
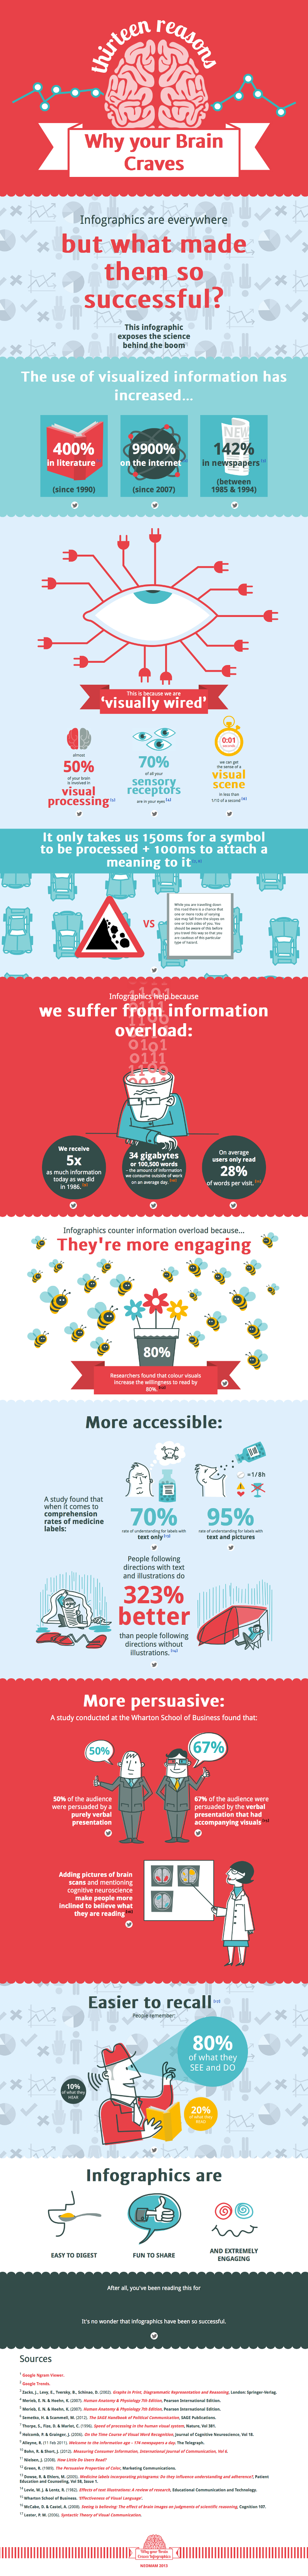
Visual Information Is Infiltrating Other Forms
In the past, some forms were reserved for written word alone, but our need for more visual images has resulted in the increase of visual communication in literature, newspapers and online. The internet is most to blame for the popularity of infographics and visual images, because now information is available in record time and in vast amounts. With so much information at our fingertips, we need more efficient ways to receive and understand information. It is much easier to quickly understand visual images than it is to read a long segment of written word. Efficiency is what makes infographics so popular and transformative. Now we can share and understand information at record speeds.
We Are Predisposed To Visually Process Information
The reason that most of us gravitate toward visual images is due to the fact that we are predisposed and wired to process visually. We don’t read word by word; instead our eyes decipher the word based on only a few letters. We pick up images faster and are able to decipher using our brain. It only takes less than 1/10 of a second for you to understand visual images. 70% of all your sensory receptors are located in your eyes, which makes it simple for you to understand images over word text. Your brain can almost automatically see and process a symbol, which allows you to act fast.
Infographics Stimulate The Brain and Do Not Overload
Visual images play on our senses and allow us to understand and receive vast amounts of information without sensory overload. The ability of visual information to engage consumers has changed the way that some businesses share information. For example, individuals are more likely to understand and comprehend prescription drug information if it is displayed in text and picture for. However, labels with only text are understood at lower rates of only 70%. The inclination to better understand visually has only led to the increase in popularity of infographics.
Although millions of people visit Brandon's blog each month, his path to success was not easy. Go here to read his incredible story, "From Disabled and $500k in Debt to a Pro Blogger with 5 Million Monthly Visitors." If you want to send Brandon a quick message, then visit his contact page here.
